
Solar Storage EV Charging Station: Import Cap, Billed Demand and Recharge Headroom
Three budgets, not one
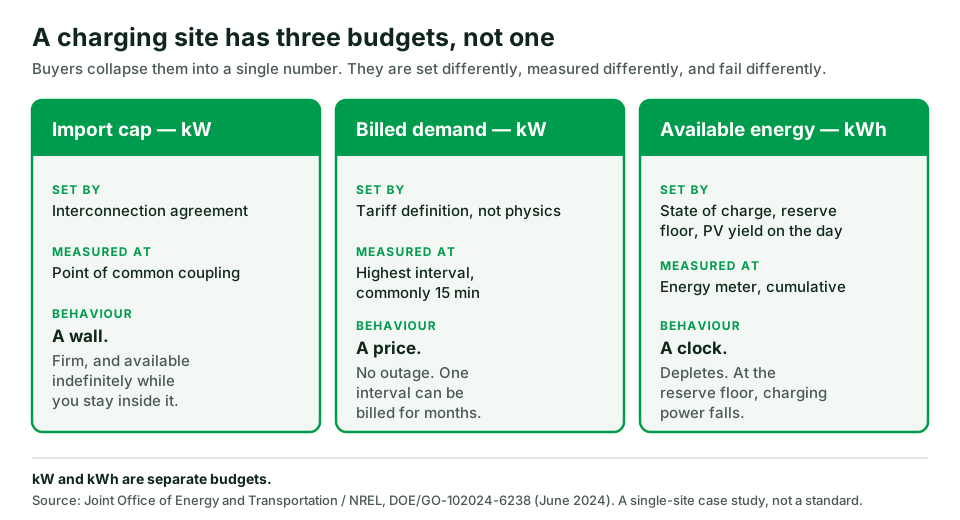
Import cap, billed demand and available energy are measured differently and fail differently
First Hour vs Design Day
Power sizing and energy sizing are separate tests with separate inputs
The PV asymmetry
PV can relax the energy test; it cannot raise the import cap or satisfy the power test
The second peak
Most sites fail on recharge headroom, not on the first arrival group
- 1. Does solar and storage actually solve your site’s constraint?
- 2. What are the three numbers a charging site actually has?
- 3. How much battery power do you need? (the First Hour criterion)
- 4. How much battery energy do you need? (the Design Day criterion)
- 5. What does solar actually change — and what does it not?
- 6. Can the battery recharge before the next arrival group?
- 7. Who is allowed to command the battery, and what happens when that controller is lost?
- 8. Why demand-charge savings disappear: billing demand, ratchet and coincident demand
- 9. Operational reserve is not arbitrage energy
- 10. DC-coupled or AC-coupled?
- 11. What fails on these sites — and how you catch it before handover
- 12. What to require at acceptance
- 13. One named configuration, with its scope stated
- 14. RFQ inputs that make bids comparable
- What this page does not prove
- Frequently asked questions
- Sources
- Related guides
Direct answer: Yes — if the site’s constraint is energy and billed demand, not firm import capacity. Battery-buffered solar charging can serve peaks above your import cap, but feasibility turns on three variables: the interconnection import cap, design-day average demand, and the reserve floor that limits usable energy. Solar relaxes the energy budget only.
This page helps you decide whether PV plus storage actually solves your site’s constraint, and then specify it precisely enough that competing bids are comparable instead of merely cheap.
Reviewed 31 October 2026. Evidence boundary: the method on this page comes from two June 2024 US federal technical-assistance documents, named in Sources. The first-party worked numbers come from one documented HG Power configuration whose charger section is GB/T; they do not describe every configuration, connector or market. No certification, saving or payback figure is claimed anywhere on this page.
| Decision | Procurement meaning |
|---|---|
| Three budgets, not one | Import cap, billed demand and available energy are measured differently and fail differently |
| First Hour vs Design Day | Power sizing and energy sizing are separate tests with separate inputs |
| The PV asymmetry | PV can relax the energy test; it cannot raise the import cap or satisfy the power test |
| The second peak | Most sites fail on recharge headroom, not on the first arrival group |
| Control ownership | If no document names the authoritative controller and its fallback, the site has no defined behaviour |
1. Does solar and storage actually solve your site’s constraint?
Before sizing anything, identify which constraint is binding. Battery buffering is a precise tool, and the wrong constraint makes it an expensive one.
| Your situation | What is actually binding | Recommendation |
|---|---|---|
| Utility will serve the full charging load, but the upgrade quote is large and the timeline is years | Capacity availability and timing | Battery buffering is the strong case. A Joint Office/NREL case study at one rural corridor site compared a ~$4M, 3–6 year substation route against a $1.2–1.5M, 1–2 year storage route — a 65% capex reduction, 2–5 years sooner. Those are that site’s figures, not a general saving |
| Import cap is adequate for average energy but peaks trip demand charges | Billed demand | Storage plus a verified control scheme. Read §8 before believing any saving estimate |
| Design-day average demand already exceeds the import cap | Energy throughput | Buffering alone will not hold. PV, load management, more import, or fewer/derated ports — see §5 |
| No firm utility service at all, or service is years away with no interim path | Interconnection itself | This is a different architecture. See off-grid solar DC charging site design |
| You need a dispatchable source and are weighing fuel | Firm capacity | Compare against diesel–PV–battery hybrid dispatch |
| Your question is really “does solar pay back here?” | Project economics | Start with solar EV charging cost, benefits and ROI. This page deliberately does not duplicate it |
One constraint this page will not solve for you: if managed charging alone (throttling sessions) is acceptable to your users, it is cheaper than storage. Several vendor pages present managed charging as the only lever. It is a real lever — it is just not free of consequence, because the consequence is delivered charging power.
2. What are the three numbers a charging site actually has?
The dominant error in commercial solar-storage charging material is collapsing power and energy into one figure. The federal case study states the distinction plainly:
“Although the existing grid infrastructure at any site can deliver only limited power (kW) capacity without utility equipment upgrades, it can provide that power indefinitely. A non-grid power source, such as a battery energy storage system, increases the charging power (kW) available at the site but has limited energy (kWh) capacity.”
A grid-tied charging site therefore has three separate budgets, and buyers routinely treat them as one number.
| Budget | Unit | How it is set | How it is measured | How it fails |
|---|---|---|---|---|
| Import cap | kW | Interconnection agreement / service equipment | Protection settings and the utility’s limit at the point of common coupling | Hard limit. Exceeding it trips protection or breaches the agreement. Available indefinitely while within it |
| Billed demand | kW | Tariff definition, not physics | Highest measured interval (commonly 15 minutes), possibly with a ratchet | Costs money without any outage. Can be set by one interval and billed for months |
| Available energy | kWh | Battery state of charge, reserve policy, PV yield on the day | Energy meter, cumulative | Depletes. When it reaches the reserve floor, charging power falls — not gracefully |
Note the asymmetry in column five. Import cap is a wall. Billed demand is a price. Available energy is a clock. A proposal that answers only one of the three has not been engineered, and a bid comparison that compares only kW and kWh of hardware cannot detect the difference. For station-level engineering and commissioning scope, see the DC fast charger station guide.
3. How much battery power do you need? (the First Hour criterion)
The federal help sheet publishes a sizing structure for the first hour of operation at full port occupancy:
“(Battery kWh) >= 150kWh (#Ports) − [ (Grid kW) (1 hour) ]”
Its own worked example: four ports with 100 kW of grid capacity need at least 500 kWh of storage to deliver 600 kWh in hour one. The 150 kWh figure is that document’s assumption — roughly a long-range electric pickup with a 200 kWh pack charged to 80% state of charge. It is an input you set, not a constant. Restated generally:
First Hour storage requirement  ≥  (per-port hour-one kWh target × ports)
                                   − (import capacity available to EV charging × 1 h)
Required discharge power = peak site demand − import cap − concurrent firm PV
(floored at zero; firm PV credit is normally zero — see §5)Worked example — Site A
A commercial site with a 200 kW firm import cap, a non-EV site load averaging 35 kW and peaking at 50 kW, and four DC ports rated at 120 kW nominal. The buyer sets a conservative 90 kWh per port for hour one, reflecting taper rather than nameplate.
| Input | Value | Where it comes from |
|---|---|---|
| Import cap | 200 kW | Interconnection agreement. Must be read, not assumed |
| Non-EV average / peak | 35 kW / 50 kW | Interval meter data |
| Import available to EV in hour one | 200 − 35 = 165 kW | Derived |
| Ports × hour-one target | 4 × 90 kWh = 360 kWh | Buyer’s own duty assumption |
| First Hour storage requirement | 360 − 165 = 195 kWh | Formula above |
| Peak site demand | (4 × 120) + 50 = 530 kW | Nameplate + site peak |
| Required discharge power | 530 − 200 − 0 = 330 kW | Formula above |
Two numbers come out, not one: 195 kWh and 330 kW. They will usually be satisfied by different quantities of hardware, and whichever is larger relative to the product’s power-to-energy ratio is what actually sets the bill of materials. Keep them separate through the whole procurement.
Across its own reference tables, NREL offers the approximation that battery buffering can reduce the grid service capacity a DC fast charging site needs by roughly 50–80%, depending on configuration. Treat that as an approximation with its own assumptions, not an entitlement — the assumptions are available from the publishing lab on request.
One structural choice sits inside this calculation: pooled or separate storage. A single bank shared across all ports is sized against the aggregate deficit and exploits the fact that ports are rarely all at peak simultaneously. Per-port storage is sized against each port’s worst case and therefore costs more in total, but it isolates a failure to one port. The federal case work sizes pooled storage. If a bid is pooled, require the diversity assumption to be stated, because that assumption is the cost saving.
The 120 kW figure above is the nominal DC module rating of one documented HG Power configuration (§13), used here as transparent arithmetic. A dual-gun cabinet rated 120 kW nominal does not deliver 120 kW to each gun simultaneously, and real session power is also capped by vehicle voltage and current acceptance.
4. How much battery energy do you need? (the Design Day criterion)
The First Hour test covers the opening surge. The design day covers the whole duty cycle. The case study sets two conditions that must hold simultaneously:
“1. Have available grid power equal to or greater than the average Design Day charging demand. 2. Have enough energy storage to support periods when charging demand exceeds the power available from the grid.”
Condition 1 is a 24-hour average, so it is forgiving. Condition 2 is a cumulative deficit, so it is not.
The federal case makes the gap concrete. At one rural corridor site with 125 kW of existing service and a requirement for four 150 kW ports — 600 kW, the study found the design-day average demand was only 68 kW, below the existing service. Condition 1 already passed. What the site needed was at least 480 kWh of pooled storage to cover the periods when demand exceeded 125 kW, against 1,632 kWh dispensed on the design day (derived from the EVI-RoadTrip tool, with that site’s traffic and vehicle assumptions). A site can be 4.8× short on power and still pass the average test — which is exactly why both conditions are required.
That same case illustrates the term utilization, defined as energy actually dispensed divided by the maximum the equipment could have dispensed: a 200 kW charger delivering 2,400 kWh in 24 hours is at 50%. Low utilization is why a site’s average demand can sit far below its peak, and it is the reason buffering works at all.
Design-day feasibility (condition 1):  import cap  ≥  design-day average total demand
Design-day energy (condition 2):       storage usable kWh  ≥  largest cumulative deficit
                                       across any period where demand > available import
Site A continued
| Input | Value |
|---|---|
| Design-day dispensed EV energy | 2,100 kWh |
| Design-day average EV demand | 2,100 ÷ 24 = 87.5 kW |
| Plus non-EV average | + 35 kW = 122.5 kW |
| Import cap | 200 kW |
| Condition 1 | 200 ≥ 122.5 → passes, with margin |
| Morning deficit block | 195 kWh (from §3) |
| Evening deficit block | 150 kWh |
| Condition 2 if the battery recharges between blocks | 195 kWh |
| Condition 2 if it does not | 195 + 150 = 345 kWh |
That last pair of rows is the whole argument of this page. The energy requirement is not a property of the load; it is a property of the load and the recharge window. Section 6 tests it.
Condition 1 passing “with margin” is also where sites get into trouble later. A 24-hour average of 122.5 kW against a 200 kW cap looks like room to add ports. It is not room, because adding ports moves the First Hour and peak-power numbers without moving the average much at all.
5. What does solar actually change — and what does it not?
This is the most consequential misunderstanding in the category, and it is not addressed by the federal documents, which exclude PV from scope entirely. The following is derived from their own criteria.
PV produces energy. It does not produce entitlement, and on the design day it may not produce much at all.
| Test | Does PV help? | Why |
|---|---|---|
| Design Day condition 1 (average demand ≤ import) | Yes | PV energy reduces the average grid draw over 24 hours |
| Design Day condition 2 (cumulative deficit) | Partly | Only for deficits that occur while the array is producing |
| First Hour | No | The criterion is built on firm import capacity. An array produces nothing at a 19:00 arrival peak |
| Import cap | No | PV does not raise the interconnection limit. It may require an export limit of its own |
| Required discharge power | No firm credit | PV is not dispatchable. Treat concurrent firm PV as zero unless a curtailment-backed control scheme is contracted and tested |
Extended feasibility test, with PV:
design-day feasibility = (import cap + design-day PV energy ÷ 24 h) ≥ design-day average demandSite C — the expansion case
Site A grows to eight 120 kW ports and 4,200 kWh dispensed on the design day.
| Step | Without PV | With a modelled 250 kWp array |
|---|---|---|
| Design-day average EV demand | 4,200 ÷ 24 = 175 kW | 175 kW |
| Plus non-EV average | 210 kW | 210 kW |
| Import cap | 200 kW | 200 kW |
| PV energy on the design day | — | 1,000 kWh → 41.7 kW average equivalent |
| Condition 1 | 200 < 210 → FAILS | 241.7 ≥ 210 → passes |
| First Hour requirement | (8 × 90) − 165 = 555 kWh | 555 kWh — unchanged |
| Required discharge power | 960 + 50 − 200 = 810 kW | 810 kW — unchanged |
PV converted an infeasible site into a feasible one on the energy test, and changed nothing on either power number. That is the asymmetry. Any proposal that reduces your battery power rating because the site has solar is sizing against an average, and your worst arrival hour is not an average.
One further trap: the design day is the stress day. If your design day is a short winter weekday or a monsoon-season weekday, the PV energy you may count is that day’s production, not the annual average from the yield report. Require the PV figure in a proposal to be stated for the design day specifically, modelled with a named tool and a named location.
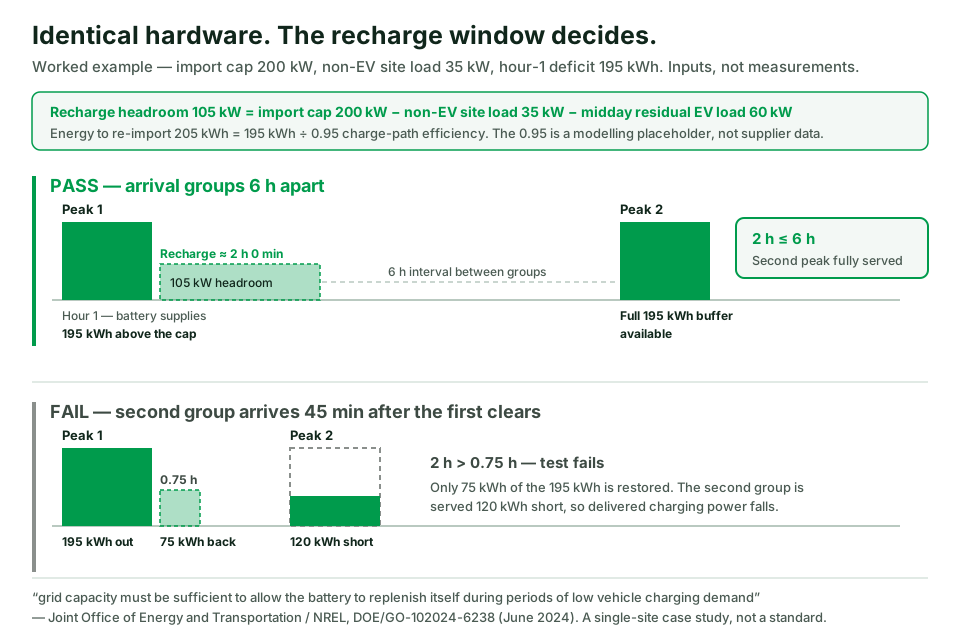
6. Can the battery recharge before the next arrival group?
This is the test almost nobody runs, and it is the one the federal case study makes a precondition:
“The battery will discharge to meet above-average vehicle charging demand, but grid capacity must be sufficient to allow the battery to replenish itself during periods of low vehicle charging demand.”
Replenishment competes for the same import cap that everything else competes for.
recharge headroom kW  =  import cap − concurrent site load − concurrent EV load
recharge time         =  energy deficit ÷ (recharge headroom × charge-path efficiency)
PASS/FAIL             =  recharge time  ≤  interval between arrival groups
Site A — pass case
| Step | Value |
|---|---|
| Energy discharged in the morning block | 195 kWh |
| Charge-path efficiency (modelling placeholder — must come from supplier data) | 0.95 |
| Grid energy needed to restore it | 195 ÷ 0.95 = 205 kWh |
| Midday residual EV load | 60 kW |
| Recharge headroom | 200 − 35 − 60 = 105 kW |
| Recharge time | 205 ÷ 105 ≈ 2 h 0 min |
| Interval to the evening group | 6 h |
| Verdict | PASS |
The same hardware — fail case
Move the site to a depot where a second group arrives 45 minutes after the first group clears — so the recharge window is 0.75 h, not 6 h. For fleet and depot arrival patterns this is normal, not pathological.
| Step | Value |
|---|---|
| Recharge window | 0.75 h |
| Grid energy imported in the window | 105 × 0.75 = 78.75 kWh |
| Energy actually restored | 78.75 × 0.95 ≈ 75 kWh |
| Still missing | 195 − 75 = 120 kWh |
| Verdict | FAIL. The second group is served with 120 kWh less buffer |
What happens next is in the federal help sheet’s own words: “if undersized, batteries may become fully depleted, leading to severely reduced charging power.” Users do not experience this as an energy-management event. They experience it as a charger that was fast in the morning and slow in the afternoon.
Note carefully what fixes this and what does not. Adding battery energy — sizing for 345 kWh instead of 195 kWh — absorbs a failed recharge for one cycle. It does not fix a repeating pattern, because each day still ends needing the same replenishment the import cap could not supply. The genuine levers are: raise the headroom (shift the non-EV load or the residual EV load out of the window), reduce the deficit (lower the hour-one target, stagger arrivals, derate ports), or raise the import cap. Only the last one changes the wall.
Require this test in writing, with your own arrival intervals, from every bidder. It is a four-row calculation and it is the single most diagnostic question you can ask.
7. Who is allowed to command the battery, and what happens when that controller is lost?
A sized system is not a specified system. Two bids with identical hardware can behave completely differently, and the federal help sheet is explicit that capability is not inherent:
“A battery energy storage system alone does not guarantee that a DCFC will operate during a power grid disruption. Hardware and software must be configured for this use case.”
Energy-management capability is implementation-specific. “EMS included” in a quotation tells you nothing a buyer can test. At minimum, require the quotation to distinguish the control modes it actually implements: load following (continuously trimming import to a setpoint as charging load moves), scheduled peak shaving against fixed windows, and — if islanded operation is in scope — whether the PCS is grid-forming at all and how anti-islanding is handled when the utility is present. These are different firmware functions, not degrees of the same feature.
Then require this record — five rows, and every row must name a thing, not a function.
Control Ownership Record
| Field | What must be named | Acceptance evidence to require |
|---|---|---|
| Measurement point | The exact physical point where import is measured, and whether it is the revenue meter or a separate CT set | Single-line diagram with the meter located; the measured value read back in the controller during witnessed test |
| Authoritative controller | One named device that owns the import-limit setpoint | Configuration export showing the limit value and who may change it |
| Command recipient | Which device receives the curtailment command — PCS, charger, or both — and over which interface | Interface list with protocol and address map; see the OCPP 2.0.1 vs 1.6 procurement guide for the charger-side interface |
| Precedence | What happens when two controllers disagree, stated as a ranked order | Witnessed conflict test: issue contradictory commands and record the outcome |
| Fallback on controller loss | The declared state when communication is lost: fail-to-safe-limit, hold-last-value, or unrestricted | Witnessed communications-loss test with the import measured throughout |
The fallback row is where unverified sites fail audits. “Hold last value” and “fail to safe limit” are completely different exposures: the first can hold an unrestricted setpoint against your import cap indefinitely.
For scale reference, one documented HG Power configuration separates these numbers in its own ratings: a 125 kW PCS supporting grid-connected and off-grid modes, and a static transfer switch rated 200 kW at the grid port but 100 kW for the critical-load path, with switching under 20 ms. Grid-port rating and critical-load rating are two different numbers in the same cabinet. Neither figure is a utility approval, a certified transfer time, or evidence that islanding is permitted at your site.
8. Why demand-charge savings disappear: billing demand, ratchet and coincident demand
Storage reduces measured demand. Your invoice charges billed demand, and the two are not the same term.
billed demand exposure = max(measured interval demand, ratchet floor, contract minimum)The ratchet term is tariff-specific and must be read from your own tariff. No generic model can supply it.
| Mechanism | What it does | What it does to a storage business case |
|---|---|---|
| Demand interval | Bills the highest average over a fixed window, commonly 15 minutes | A control scheme that reacts after the interval has already been set saves nothing that month |
| Demand ratchet | Sets a floor based on a prior peak, often the highest of the last 11 months | One uncontrolled event — a commissioning test, a controller outage, a fallback to “unrestricted” — can be billed for a year |
| Coincident demand | Bills your demand at the time of the system peak, not your own | Shaving your own peak may not touch this charge at all |
| Contract minimum | Floors the billed figure regardless of usage | Caps the achievable saving before any engineering happens |
| Time-of-use energy | Separate from demand entirely | Arbitrage savings and demand savings are different mechanisms competing for the same kWh — see §9 |
The federal help sheet lists operating-cost reduction as one of three use cases but keeps the tariff mechanics qualitative; the case study is a capacity study, not a rate study. Neither source supports a demand-charge saving figure, and this page does not publish one. Any supplier who quotes you a demand saving before reading your tariff and your interval data has calculated a hope.
What to do instead: obtain 12 months of interval data and the full tariff sheet including the ratchet clause, then require every bidder to compute the saving from those two documents and show the arithmetic. Asset owners weighing this across a portfolio should start from EV charging for commercial properties.
9. Operational reserve is not arbitrage energy
Nominal battery capacity is not deliverable energy, and the gap is larger than most proposals admit.
usable energy = nominal kWh × (SOC_start − SOC_reserve_floor) × discharge-path efficiencyApplied to one documented HG Power configuration — 261 kWh nominal, depth of discharge limited to ≤95%, default discharge-stop state of charge 20%:
| Term | Value |
|---|---|
| Nominal | 261 kWh |
| Usable SOC window | 95% − 20% = 75% |
| Discharge-path efficiency (modelling placeholder) | 0.95 |
| Usable energy | 261 × 0.75 × 0.95 ≈ 186 kWh |
| Reduction from nominal | ≈ 29% |
Note that the discharge-path figure above is one direction only. Round-trip efficiency — the ratio of energy delivered out to energy imported in — compounds the charge path from §6 with the discharge path here, so a site that models 0.95 in each direction is losing roughly 10% of every buffered kilowatt-hour before any reserve policy is applied. Ask for the round-trip figure at the point of common coupling, measured, not the cell-level number.
The same configuration documents grid start/stop thresholds at 30% and 40% state of charge by default. That is the system reclaiming grid import to defend its own reserve — which is precisely the point: the reserve floor is not available for arbitrage, peak shaving, or the second arrival group. The same kWh cannot be sold twice. Any business case that shaves demand with the full nominal rating has already double-counted.
So Site A’s 195 kWh requirement is not met by one 261 kWh unit. Returning to the two numbers from §3:
| Requirement | Site A value | Units needed |
|---|---|---|
| Discharge power | 330 kW | 330 ÷ 125 = 2.64 → 3 |
| Usable energy | 195 kWh, or 345 kWh if recharge fails | 195 ÷ 186 = 1.05 → 2; 345 ÷ 186 = 1.85 → 2 |
| Binding constraint | — | Power. 3 units → 375 kW and ≈558 kWh usable |
Site A is power-limited, not energy-limited. Knowing which one binds tells you where value engineering is safe and where it is destructive. Note that these are the documented defaults of one model, not an engineering rule and not your project’s commissioned settings — reserve policy is a decision you must make and record.
10. DC-coupled or AC-coupled?
| DC-coupled | AC-coupled | |
|---|---|---|
| PV path to the vehicle | PV → DC bus → charger, one conversion step fewer | PV → inverter → AC bus → charger rectifier |
| Typical packaging | Integrated cabinet, shared DC bus and shared controls | Separate PV inverter, BESS PCS and charger, often separate vendors |
| Control ownership | Usually one vendor — simpler §7 record | Must be contracted explicitly across vendors |
| Flexibility | Expansion constrained by the shared bus and cabinet | Components scale and are replaced independently |
| Where it struggles | Vendor concentration; field repairs touch one integrated unit | Interface testing and the question of who owns the import limit |
One named DC-coupled example: the documented HG Power integrated configuration uses two 100 kW MPPT/DC-DC modules on a shared DC bus with a 125 kW PCS. That is one topology, documented for one model — not a universal array or string design. (The same manual contains conflicting PV string examples, so no string configuration is quoted here.) The commercial page for this configuration is the integrated solar-storage-charging station.
The decision is rarely efficiency. It is almost always control ownership and who you can hold responsible after handover.
11. What fails on these sites — and how you catch it before handover
| Symptom | Likely root cause | How to verify | Mitigation |
|---|---|---|---|
| Fast in the morning, slow in the afternoon | Recharge headroom insufficient; battery at reserve floor | Log SOC and import against time for one full design day | Re-run §6 with real arrival intervals; shift the non-EV load out of the recharge window |
| Demand charge unchanged after storage commissioning | Ratchet floor, coincident-demand charge, or a control scheme slower than the demand interval | Compare invoice line items against interval data for the same month | Read the tariff’s ratchet clause; require sub-interval control response |
| Import cap breached during a routine event | Fallback on controller loss is “hold last value” or unrestricted | Witnessed communications-loss test with import measured | Specify fail-to-safe-limit in §7 and re-test |
| Second port derates when both are occupied | Cabinet nominal rating treated as per-gun rating | Simultaneous dual-session test with both outputs metered | Size on nominal cabinet output, not gun count |
| Delivered session power below the quoted kW | Vehicle voltage/current acceptance, not site capacity | Record vehicle-side voltage and current during the session | Compare bids on energy delivered to a named vehicle, not on nameplate |
| PV “credit” never materialises in the peak hour | Firm capacity credited to a non-dispatchable source | Overlay the PV profile on the arrival profile for the design day | Set concurrent firm PV to zero in power sizing (§5) |
| Battery full but site still constrained | Energy was the wrong budget; power or import cap binds | Check which constraint binds, per §9 | Re-size for discharge power, or reduce peak demand |
Every row above is a failure mode derived from the sizing logic on this page. None is presented as an observed HG Power project outcome, and no site case is claimed.
12. What to require at acceptance
This list states what a buyer should require. It does not describe a service HG Power performs.
- Import-limit conformance. Drive the site above the import cap with ports loaded and record that the controller holds the limit at the named measurement point.
- Communications-loss test. Disconnect the authoritative controller and record the resulting import for the full declared fallback behaviour.
- Controller-conflict test. Issue contradictory setpoints from two sources and record which one prevails against the documented precedence order.
- Recharge-window test. Discharge to the design deficit, then measure the time to restore the target state of charge with the real site load present. Compare against §6.
- Reserve-floor behaviour. Confirm discharge stops at the contracted floor and record what the chargers do at that moment.
- Dual-session output test. Both guns loaded, both outputs metered, recorded against the quoted nominal rating.
- Settings backup. A written export of all control setpoints, signed, with a named owner authorised to change them.
- Interconnection documentation. The signed agreement, the applied protection settings, and — where the jurisdiction adopts them — the interconnection and conformance-test framework the utility requires. IEEE 1547 and IEEE 1547.1 define DER interconnection and conformance testing where they are adopted; the serving utility’s rules govern, and no product on this page is claimed to hold any certification under them.
Items 1–6 are tests a buyer can witness in a single day. A supplier unwilling to commit to them in the contract is asking you to accept the sizing on trust.
13. One named configuration, with its scope stated
HG Power’s DC charging portfolio is stated as 40–480 kW. Wall-mounted and portable DC products are a separate family listed at 20/30/40 kW and are not part of that station range.
The integrated configuration referenced throughout this page is the GCC261K-125 integrated solar-storage-charging system, documented in its user manual (V2.0, November 2025):
| Documented item | Value | Scope |
|---|---|---|
| Battery nominal energy | 261 kWh, depth of discharge ≤95% | This model |
| PCS | 125 kW, grid-connected and off-grid modes | This model |
| Static transfer switch | 200 kW grid port, 100 kW critical-load maximum, switching <20 ms | This model |
| PV conversion | Two 100 kW MPPT/DC-DC modules | This model |
| DC charging module | 120 kW nominal, dual-gun, 200–1000 Vdc, max 200 A | This model |
| Default SOC settings | Discharge stop 20%; grid start/stop 30%/40% | Manual defaults, not project settings |
| Charging-module efficiency / power factor / enclosure | ≥95.2% / ≥0.99 / IP54 | This model |
| Charger standards referenced | GB/T 20234 / 18487 / 27930 | GB/T configuration |
The critical scope statement: the documented charger section of this configuration is GB/T. The federal method quoted on this page comes from US corridor case work assuming CCS ports. The arithmetic is connector-agnostic; the configuration is not. This configuration as documented is not presented as a CCS or NACS product and not as deployable on a US corridor. Destination connector, certification package and installation requirements are quotation-specific.
For general background on the technology family, see the solar battery storage EV charging systems guide — context only; it is not a source of product specifications.

14. RFQ inputs that make bids comparable
Send the same seven inputs to every bidder. Without them, you will receive quotations that are not comparable in any dimension except price.
- Grid import and export limits, as stated in the interconnection agreement or application — in kW, with the measurement point named.
- Twelve months of interval site load data at the tariff’s demand interval, non-EV loads separated.
- The full tariff sheet, including the demand ratchet clause, coincident-demand terms and any contract minimum.
- Vehicle arrivals and departure energy: groups, arrival times, intervals between groups, energy required at the inlet, connector type.
- PV profile for the design day — not the annual average — with the modelling tool and location named.
- BESS reserve policy: the state-of-charge floor you are contracting, and what the chargers must do when it is reached.
- Proposed control topology: the completed Control Ownership Record from §7, all five rows.
Then require each bidder to return: the First Hour and Design Day numbers computed from your inputs; the §6 recharge calculation against your arrival intervals; and a commitment to acceptance items 1–6.
Request a comparable RFQ response with these inputs. If you would rather not send anything yet, copy the Control Ownership Record table from §7 and the acceptance list from §12 and issue them yourself — no form required.
What this page does not prove
- It does not prove any certification. No claim is made that any HG Power product is certified to IEEE 1547, IEEE 1547.1, UL 1741 SA/SB, UL 9540 or any other standard. Those frameworks are named at the level of scope and purpose only, and they apply only where adopted or required.
- It does not prove a saving, payback or ROI. No demand-charge saving, payback period or return figure is published here, because no verified basis for one exists in the sources used.
- The cost and timeline comparison in §1 is one site’s. The ~$4M/3–6 year versus $1.2–1.5M/1–2 year comparison, the 65% capex reduction and the 2–5 year acceleration belong to a single Joint Office/NREL technical-assistance case at a rural corridor site, with that site’s assumptions. They are not a general result.
- The federal documents are case studies and help sheets, not standards. The help sheet states of itself that it “is not intended to be used as guidance, set policy, or establish or replace any standards under state or federal law.” This page respects that. Where it cites a reduction in required grid service capacity of roughly 50–80%, that is an NREL approximation derived from the documents’ own reference tables.
- The first-party configuration is GB/T. Every GCC261K-125 figure describes that documented model in that configuration. It does not extend to other HG Power products, other connectors, other markets or your ordered configuration.
- Efficiency values marked as placeholders are placeholders. The 0.95 charge- and discharge-path figures are modelling assumptions used to make the arithmetic auditable. Replace them with supplier data before specifying anything.
- No model-consensus or AI-citation claim is made. No multi-platform language-model evaluation was performed for this page.
- The first three FAQ questions are a historical search-suggestion sample from 15 October 2026. They are not presented as current.
- No failure case on this page is an HG Power project record. Section 11 lists failure modes derived from the sizing logic, not observed site outcomes.
- HG Power is not presented as a commissioning or test service provider. Sections 7 and 12 state what a buyer should require from whoever supplies and integrates the system.
Frequently asked questions
Historical search-suggestion sample, captured 15 October 2026 — not current:
Are any EV charging stations powered by solar? Yes, in two distinct architectures. Grid-tied sites use PV and storage behind a utility connection to manage the import cap, billed demand and energy budget — the subject of this page. Sites without firm service use a different architecture covered in the off-grid design guide. The difference is not scale; it is whether firm import exists.
Can I charge my EV directly from solar panels? Not usefully at DC fast-charging power without conversion and buffering. An array’s output varies with irradiance while a charging session needs a controlled voltage and current within the vehicle’s acceptance window. In practice PV feeds a DC bus or an inverter, and storage absorbs the mismatch between what the array produces and what the vehicle will take.
How much does a solar EV charging station cost? This page publishes no price, because no verified basis exists for one. Structurally, cost is driven by: required discharge power (§3), usable energy after the reserve floor (§9), whether your import cap must be raised, PV array size, and the control and interface scope in §7. The federal case study notes incremental storage cost in a $400–$1,000/kWh range for its site, against an NREL ATB 2023 figure of roughly $350/kWh at cell/cabinet level — those are that document’s figures for its own analysis, not a quotation.
Editorial questions, not search suggestions:
Does solar let me install more chargers than my import cap allows? No. PV does not raise the import cap, and it is not firm capacity in the arrival hour. Storage is what lets you serve peaks above the cap. PV helps you sustain those peaks day after day by reducing the energy you must import — which is the Design Day test, not the First Hour test. See §5.
How do I know the battery will recharge before the evening peak? Compute it. Recharge headroom is the import cap minus concurrent site load minus concurrent EV load; recharge time is the energy deficit divided by that headroom and the charge-path efficiency. Compare it against your own interval between arrival groups. Section 6 shows the same hardware passing at a six-hour interval and failing at 45 minutes.
What happens to charging if the EMS loses communication? Whatever the fallback row of your Control Ownership Record says — which is why it must be written down and witnessed. The three common behaviours are fail-to-safe-limit, hold-last-value, and unrestricted. If nobody has specified it, the site’s behaviour during a controller outage is undefined, and an unrestricted fallback can breach your import cap or set a demand ratchet that bills for a year.
Will a battery eliminate my demand charges? No, and it may not reduce them as much as a proposal implies. Billed demand is the maximum of measured interval demand, any ratchet floor and any contract minimum, and a coincident-demand charge is billed at the system peak rather than yours. Section 8 lists the mechanisms. Require every bidder to compute the saving from your own tariff sheet and interval data.
Can this site run during a grid outage? Only if it was configured to. The federal help sheet is explicit: “A battery energy storage system alone does not guarantee that a DCFC will operate during a power grid disruption. Hardware and software must be configured for this use case.” Islanded operation also depends on the serving utility’s rules and the transfer-switch and critical-load boundary — note in §13 that the grid-port rating and the critical-load rating of one documented configuration are different numbers. Where it is configured, duration is simple arithmetic: the same help sheet gives an example of 500 kWh supporting an average 50 kW load for up to about 10 hours. That is a worked illustration of division, not a capability of any product, and it assumes the configuration the quotation above says must be deliberately engineered.
What should I witness at commissioning? The six tests in §12 that can be run in one day: import-limit conformance, communications loss, controller conflict, the recharge window, reserve-floor behaviour, and a dual-session output test. Plus a signed export of every control setpoint, with a named owner authorised to change it.
Sources
Reviewed 31 October 2026.
- Joint Office of Energy and Transportation / National Renewable Energy Laboratory, Grid-Constrained Electric Vehicle Fast Charging Sites: Battery-Buffered Options, Technical Assistance Case Study, DOE/GO-102024-6238, June 2024. Single-site case study; not a standard or policy.
- Joint Office of Energy and Transportation / National Renewable Energy Laboratory, Battery Energy Storage for Electric Vehicle Charging Stations, Technical Assistance Help Sheet, DOE/GO-102024-6237, June 2024. Explicitly not guidance, policy or a standard.
- IEEE 1547-2018, Standard for Interconnection and Interoperability of Distributed Energy Resources with Associated Electric Power Systems Interfaces, and IEEE 1547.1, conformance test procedures. Cited at scope level; applicable only where adopted or required.
- HG Power, HJL 261kWh-125kW Integrated Solar Storage Charging System GCC261K-125 User Manual, V2.0, November 2025. GB/T charger configuration.
- US Department of Energy, solar-plus-storage resilience basics, and NREL PVWatts / REopt for PV and economic modelling inputs. Used as modelling-tool references only; no figures reproduced.
Related guides
- Solar EV charging stations: cost, benefits and ROI — project economics and general PV sizing
- Off-grid solar DC EV charging site design — sites with no firm utility service
- Diesel, PV and battery hybrid EV charging — when firm dispatchable capacity is required
- DC fast charger station guide — station engineering, site survey and commissioning scope
- OCPP 2.0.1 vs 1.6 procurement guide — the charger-side control interface