
Diesel-PV-Battery Hybrid EV Charging: Sizing an Off-Grid DC Site
Separate charger kW from daily kWh, keep the genset inside a declared loading window and turn five dispatch states into witnessed evidence.
Direct answer: A diesel-PV-battery hybrid EV charging site combines solar generation, battery storage and a generator under one energy-management controller. Size it with two ledgers: instantaneous power in kW and energy over time in kWh. PV offsets energy, the battery buffers charger steps and shifts solar, and the genset restores energy during prolonged deficits. The design is complete only when its dispatch states, SOC reserve, generator loading, failure modes and FAT/SAT tests are written into the order.
When does a diesel-PV-battery charging system make sense?
This architecture fits sites where the grid is absent, unreliable or too small for the required DC charging duty and where a generator already exists or provides a justified resilience layer. Typical candidates include mines, remote construction projects, isolated fleet depots, temporary infrastructure and corridor sites with difficult utility access.
It may be the wrong answer when a modest grid upgrade can serve the duty at lower lifecycle cost, when daily charging energy greatly exceeds the available solar and fuel logistics, or when the site cannot maintain batteries, power electronics and a generator. A battery does not turn an energy-deficient site into an energy-surplus site. It changes when power is available and how quickly the generator must respond.
The existing HG Power solar EV charging station guide owns general PV, storage, grid and charging feasibility. This guide addresses the narrower generator-backed case: how diesel loading, low-sun recovery and DC fast-charger steps change the design and acceptance plan.
Define the system boundary before selecting equipment
Every energy path meets at the EMS and the site bus
daily kWh
→
SOC reserve
↔
→
session priority
loading window
→
defined limit
↔
→
Power paths are illustrative. The ordered AC/DC topology, protection and metering boundaries control the project.
A complete hybrid charging site contains at least five controllable elements:
- PV generation with array, combiner, MPPT and conversion equipment.
- Battery energy storage with BMS, usable SOC window, charge/discharge power and thermal controls.
- Diesel genset with an engine control unit, start/stop interface, fuel curve and minimum stable loading requirement.
- DC charging equipment with a defined vehicle voltage/current envelope, connector, power-allocation rule and session data.
- Energy management system (EMS) that decides which source runs, which load receives priority and how the system behaves after a fault.
Critical site loads, an optional weak-grid connection, switchgear, metering and communications also sit inside or next to that boundary. The quotation must show who supplies and controls each interface. “Solar + storage + generator ready” is not a control specification.
The U.S. Department of Energy treats solar, batteries and emergency generators as distributed-energy resources that require coordinated microgrid control. IEA PVPS guidance adds a practical constraint: a controller must protect the generator from low-load and reverse-power conditions while maintaining enough reserve for sudden PV or load changes.
Start with a 15-minute charging and site-load record
Do not begin with charger nameplate power. Begin with the duty the site must perform.
For every charging event, record the vehicle, inlet, arrival SOC, departure SOC, energy required, earliest arrival, latest departure and whether another session overlaps. Add non-EV loads such as pumps, workshops, lighting, communications, accommodation or safety systems. Mark which loads can be delayed and which must remain powered.
Use 15-minute intervals for an early energy model and finer data for transient/control studies. DC fast chargers can create faster step changes than a 15-minute average reveals, so the final controller and BESS-power study must use a time resolution appropriate to the selected equipment.
| Input | Why the model needs it | Failure when omitted |
|---|---|---|
| Energy per vehicle and departure time | Sets the minimum delivered kWh by a deadline | Charger is sized for peak power but vehicles leave short of energy |
| Concurrent sessions | Sets the combined DC and AC-bus demand | One-session design collapses during overlap |
| Vehicle acceptance curve | Limits real power below charger nameplate | Charging-time promise uses an unreachable constant kW |
| Critical non-EV loads | Reserves power and energy for site operation | Charging trips essential equipment or drains emergency reserve |
| Seasonal operating calendar | Captures high-duty and low-solar periods | Annual average hides the worst week |
| Curtailable loads and charging priorities | Gives the EMS safe actions before starting diesel or shedding load | Controller has no agreed fallback order |
For the wider survey-to-handover process, see the DC fast charger station guide. For depot arrival and departure planning, use the fleet EV charging guide.
Decision model 1: Two-Ledger Sizing
The most common design error is treating kW and kWh as interchangeable.
Power ledger: can the system survive the highest simultaneous demand?
At every time step:
available source power ≥ charger input + critical loads + conversion losses + reserve requirement
For an early BESS-power check:
required BESS discharge kW ≥ site load kW - firm PV kW - committed genset kW - available grid kW
Use conservative PV during the event, not the array's noon nameplate. Confirm that the battery, PCS, cabling and thermal system can sustain the required discharge power for the event duration and ambient condition.
Energy ledger: can the site replenish what it delivers?
Over a day or a multi-day design period:
energy in = usable PV + grid import + generator energy
energy out = EV energy + critical-load energy + conversion losses + required reserve restoration
Storage shifts energy but does not create it. If repeated charging sessions consume more than PV and permitted generator runtime can replace, the SOC falls day after day even when the battery is very large.
Sandia's DC-fast-charging study treats PV size, BESS power, BESS energy and dispatch as separate optimization variables. Apply the same discipline here. A supplier that quotes only “261 kWh storage plus 120 kW charging” has not yet shown the site's energy balance or its peak-power margin.
Size PV from a site-specific yield, not from charger kW
PV design starts with an hourly or sub-hourly production profile for the actual coordinates, array orientation, shading, temperature and soiling assumptions. A preliminary calculation may use:
daily PV energy = installed PV kWp × site yield (kWh/kWp/day)
The model must then subtract curtailment and conversion losses and test the lowest relevant seasonal production, not only an annual average.
A 100 kW array does not guarantee 100 kW at the charger. Output changes through the day and can fall quickly during cloud events. IEA PVPS notes that PV-diesel systems may need online reserve for these reductions; a battery can absorb the fast difference and reduce how much spinning diesel reserve must remain online.
PV oversizing can improve low-sun production but may increase curtailment when batteries are full and charging demand is low. The right decision depends on land, module orientation, seasonal duty, permitted export and whether flexible charging can follow solar production.
Size the battery twice: usable kWh and deliverable kW
The BESS must satisfy both ledgers.
Energy requirement
For a defined deficit window:
required nominal battery energy = deficit energy ÷ usable SOC fraction ÷ discharge-path efficiency
Then add the agreed resilience reserve and account for temperature, ageing and manufacturer operating limits. Do not insert a generic depth-of-discharge or cycle-life number. Use the warranted values for the quoted battery system and operating profile.
Power requirement
The battery/PCS must also cover the largest source-load gap, charger ramp and generator start interval. A system may contain enough kWh but still trip because its PCS cannot deliver the required kW, current or transient response.
Record at least:
- continuous and short-duration charge/discharge power;
- usable SOC window and emergency reserve;
- temperature and altitude derating;
- generator-start time and failed-start response;
- recharge power after a deep duty period;
- simultaneous charging and critical-load demand;
- thermal-management auxiliary load;
- BMS/EMS communications-loss behavior.
Decision model 2: The Generator Window Test
The genset does not have to match the charger label one-for-one if PV and BESS cover part of the instantaneous demand. It does have to restore the energy balance and remain within a stable operating region for the selected engine.
IEA PVPS operator guidance uses roughly 80% of rated capacity as a useful loading reference and recommends avoiding operation below 40%. Treat those figures as an early planning check, not as universal limits. The actual generator fuel curve, minimum-load requirement, overload rating, ambient derating and maintenance guidance control the project.
Run four tests:
- Lowest planned load: When the genset is on, can the EMS keep it above the selected model's minimum stable load without wasting energy or overcharging the BESS?
- Highest sustained load: Can it serve critical loads and recharge the BESS after the design deficit without exceeding its continuous rating?
- Fast disturbance: Can BESS and controls bridge charger steps, cloud events and genset start time?
- Extended low-sun duty: Can fuel delivery, runtime, maintenance intervals and reserve meet the worst design period?
If one large genset spends much of its life lightly loaded, compare staged units or different ratings. IEA PVPS guidance describes multiple or ascending generator sizes as one way to follow varying demand more efficiently. The decision remains project- and engine-specific.
Decision model 3: Write Five-State Dispatch before ordering
Five states make the controller promise testable
Each state needs a trigger, power limit, SOC rule, fallback action and recorded acceptance case.
The EMS sequence should exist as an approved table, not an unwritten commissioning choice.
| State | Typical trigger | Source priority | Required controller action | Evidence |
|---|---|---|---|---|
| 1. Solar surplus | PV exceeds active load and BESS can accept energy | PV to load, then BESS | Limit/curtail PV when battery or network limit is reached | Trend showing PV, SOC and curtailment |
| 2. Normal charging | PV plus planned battery discharge serves duty | PV + BESS; genset off where reserve permits | Hold SOC above operating floor and follow charging priority | Stable session with critical loads present |
| 3. Peak or cloud step | Charger demand rises or PV drops faster than genset response | BESS supplies transient; EMS evaluates genset start | Maintain bus voltage/frequency and respect PCS limit | Step-load and cloud-ramp simulation/FAT |
| 4. Prolonged deficit | SOC/forecast/load reaches start threshold | Genset serves load and/or recharges BESS inside declared loading window | Start, synchronize/transfer, set charge power, enforce stop threshold | Start/stop sequence, fuel/load trend and recovery time |
| 5. Fault or maintenance | Communications, BMS, inverter, genset or safety fault | Safe source/load state defined by hazard analysis | Shed non-critical charging, preserve critical loads where designed, alarm and record | Fault-injection test and event log |
Add a sixth state when a weak grid is present. The table must state import limit, islanding permission, transfer logic, anti-islanding responsibility and reconnection conditions.
AC bus or DC bus: choose the boundary, then count conversions
Neither architecture is automatically better. Compare it against the required equipment, service capability and evidence package.
| Architecture | Possible advantage | Buyer must verify | Common hidden issue |
|---|---|---|---|
| AC-coupled PV/BESS/genset feeding a conventional DC charger | Familiar equipment boundaries and easier integration with AC site loads | inverter/PCS ratings, transfer/synchronization, charger input, harmonics, protection and losses | each conversion stage is omitted from energy model |
| DC-coupled PV/BESS and DC charger | may reduce conversion stages and support a shared DC bus | voltage ranges, isolation, fault protection, DC switchgear, controls and destination acceptance | incompatible DC voltage windows or unclear fault responsibility |
| Hybrid AC/DC bus | lets specific sources and loads use their natural bus | exact energy-flow paths and operating states | proposal shows every option but no single ordered topology |
Ask for a one-line diagram with metering points. At minimum log PV energy, genset energy/fuel or operating load, BESS charge/discharge/SOC, charger energy, critical-load energy, curtailment and alarms. Measurement boundaries must be consistent or the operator cannot reconcile losses.
What HG Power's supplied material documents
HG Power's public DC charger portfolio spans 40–480 kW, but that portfolio range does not establish the power of a diesel-PV-battery system. The supplied V2.0 product presentation lists two separate integrated sample configurations:
| Presentation configuration | Storage capacity | DC charging port | Generator input | PV input | Maximum load output |
|---|---|---|---|---|---|
| 110K-50 | 110 kWh | 50 kW | 50 kW | 50 kW | 100 kW |
| 261K-125 | 261 kWh | 120 kW | 125 kW | 100 kW | 125 kW |
The same presentation describes PV-priority, storage regulation, generator backup, MPPT/DC-DC integration and generator communications as solution features. Treat them as configuration objectives to confirm in the quotation and FAT. The presentation does not by itself prove usable energy, transfer time, destination certification, connector choice, field savings or sustained performance for a future order.
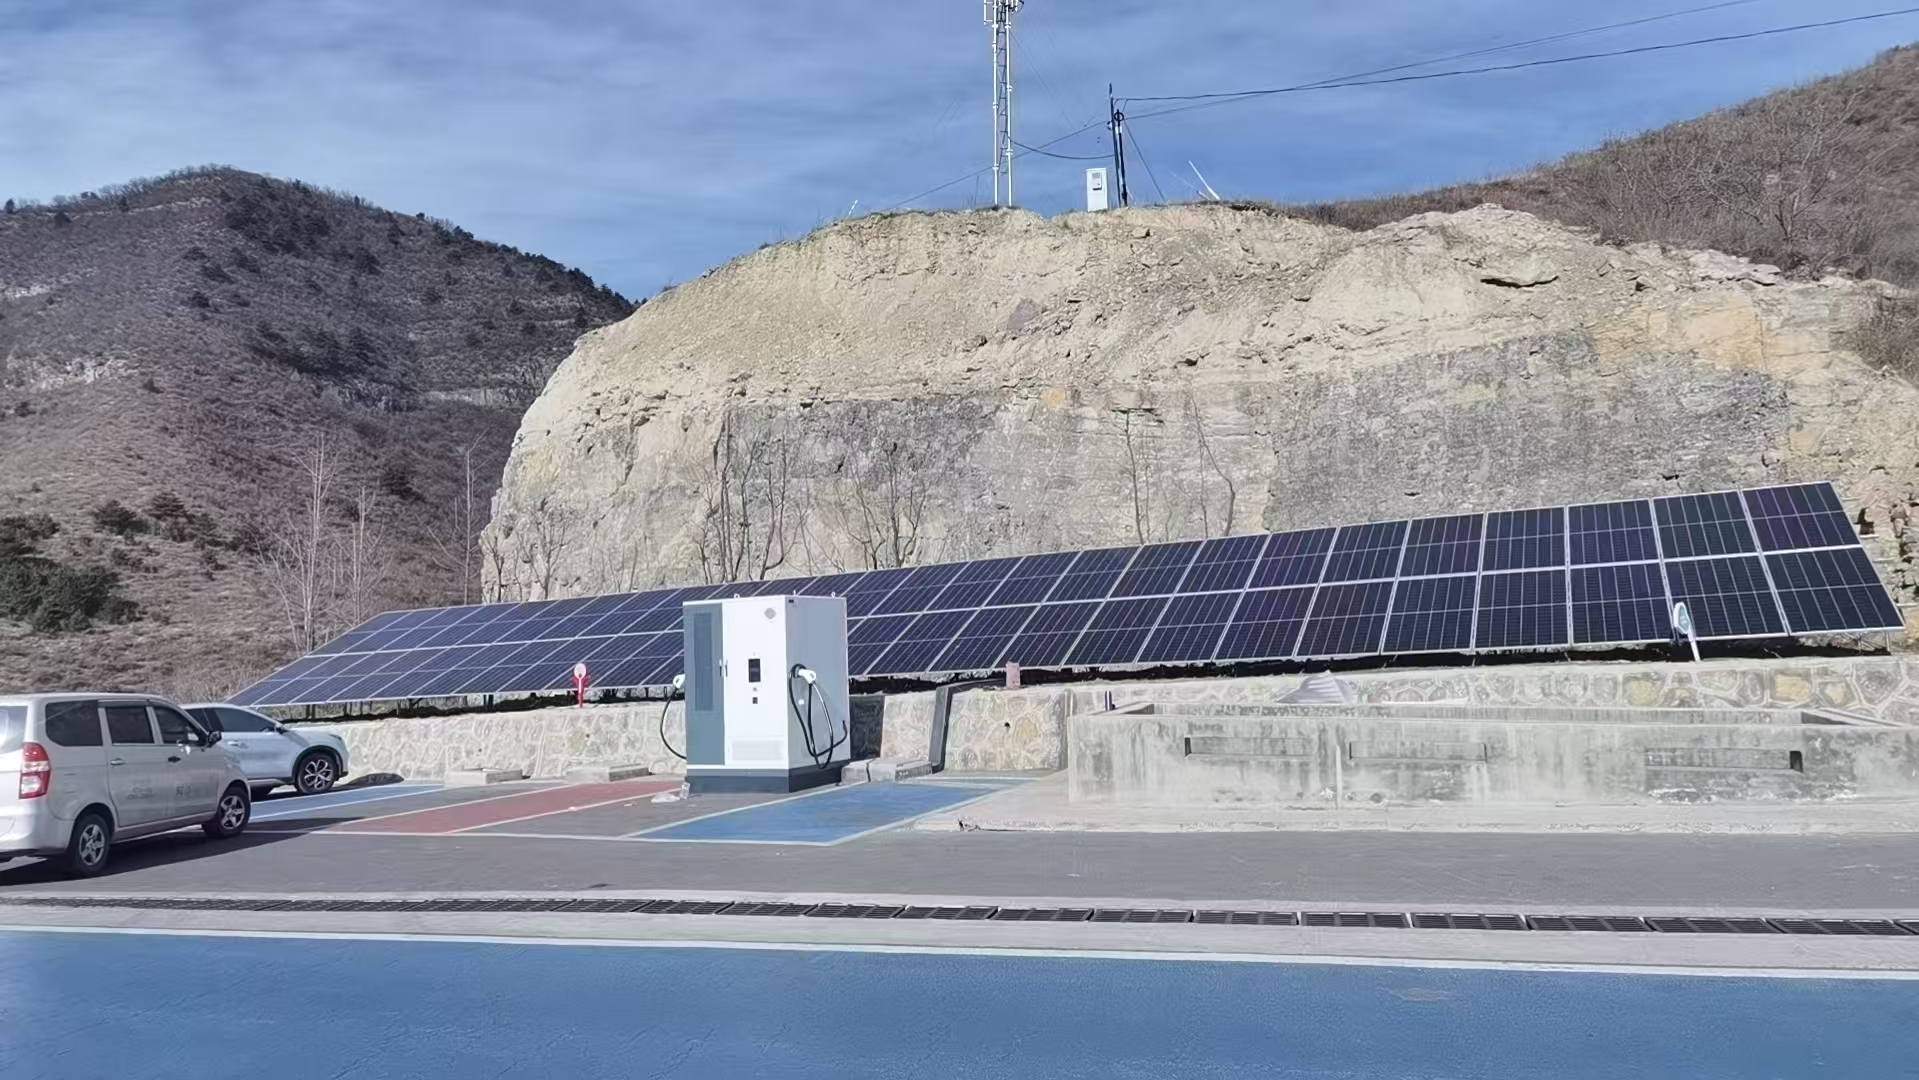
The photographed PV-and-charging installations in HG Power's supplied material establish visible project context only. They do not prove that a pictured site uses diesel, the rating of its equipment, energy yield, uptime or commercial return.
Six project killers and how to expose them early
| Symptom | Likely root cause | Verification | Mitigation |
|---|---|---|---|
| Battery reaches minimum SOC every evening | daily energy deficit, not just a small battery | multi-day energy simulation using seasonal PV and actual duty | add firm energy, reduce/delay duty or resize sources |
| Genset runs for long periods at light load | genset oversized or start/stop thresholds poorly chosen | engine load histogram and fuel curve | stage units, resize or change dispatch |
| Charger resets during a second connection | PCS/genset/transient limit below the fast load step | high-resolution bus and BESS-power trace | increase power margin or manage session ramp/concurrency |
| PV is frequently curtailed while diesel still runs later | storage/charging timing and forecast logic do not align | PV, SOC, curtailment and genset trend | reschedule charging or revise SOC/forecast control |
| Critical loads are lost after a component fault | load priorities and island/fault state were never defined | fault matrix and witnessed fault injection | separate critical bus and approve fallback states |
| Fuel savings cannot be verified | no baseline, inconsistent meters or changing load | common-boundary energy and fuel records | agree baseline, metering and reporting before operation |
Decision model 4: The Hybrid Acceptance Ladder
1. Design review
Approve the single-line diagram, equipment schedule, load/PV datasets, dispatch table, protection philosophy, communications map, meter boundaries, fault matrix and assumptions register.
2. Controller simulation
Run the design load profile through low-sun, high-duty, failed-start and communications-loss cases. Record SOC, generator load, curtailed PV, unmet load and charging priority.
3. Factory acceptance test
Witness source transitions, charger load steps, generator start/stop commands, SOC thresholds, power limits, alarms, emergency stop, communications loss and recovery. A function menu is not a test record.
4. Site acceptance test
Repeat agreed cases with the installed switchgear, cabling, grounding, communications, charger and site loads. Confirm the destination's inspection and safety requirements separately.
5. Operating-data review
After an agreed operating period, compare real load, PV, SOC, generator runtime/load, charging energy, curtailment and alarms against the design model. Tune thresholds only under change control and retain the settings backup.
Model total cost without inventing a savings percentage
A valid comparison uses the same delivered charging duty and resilience target for diesel-only, PV-diesel, battery-diesel and PV-battery-diesel cases.
Include:
- delivered fuel price, fuel curve, logistics and storage;
- generator capex, runtime-based maintenance and overhaul assumptions;
- PV capex, site yield, degradation, cleaning and curtailment;
- BESS/PCS capex, usable SOC, efficiency, degradation, augmentation/replacement and thermal auxiliary energy;
- charger and site electrical/civil scope;
- monitoring, communications, spares and technician access;
- financing, taxes and residual value where applicable;
- the defined cost of unmet charging or critical-load interruption.
Do not compare a resilient hybrid design with an unreliable diesel baseline and call the difference “fuel savings.” Reliability, duty and service level must match.
Twelve inputs for a comparable hybrid-site RFQ
- Destination country, site coordinates, altitude, temperature, dust/salt/rain exposure and applicable rules.
- Vehicle/inlet list, charging curves where available and energy required by departure.
- Charging-event schedule, maximum concurrency and priority vehicles.
- Fifteen-minute or finer EV and non-EV load profile, with critical/curtailable classification.
- Existing grid details, import/export limit and outage history, if any.
- PV area, shading, orientation and agreed solar dataset/design period.
- BESS objective, usable reserve, required autonomy and acceptable unmet-load criterion.
- Existing/proposed genset models, continuous ratings, fuel curves, minimum-load rules and start times.
- Preferred AC/DC bus architecture and required charger output/configuration.
- EMS, remote monitoring, charger backend/OCPP and communications ownership.
- Required drawings, calculations, conformity documents, FAT/SAT cases and thresholds.
- Commercial boundary: equipment, freight, site works, fuel system, installation, commissioning, training, warranty, spares and service.
Ask every bidder to return the assumptions, exclusions and values they could not verify. That register often reveals more than a headline system price.
Frequently asked questions
What is a diesel-PV-battery hybrid system?
It is a local power system that coordinates solar PV, battery storage and a diesel generator to serve loads. For EV charging, the DC charger is one load with large, variable power steps. The EMS decides when PV serves the load, when the battery charges or discharges and when the genset starts.
Can an off-grid system run a DC fast charger?
Yes, when the generation, storage, conversion equipment and controls meet both the charger's instantaneous kW and the site's energy requirement over the design period. A charger label alone does not establish feasibility.
Can the generator be smaller than the DC charger?
Potentially. PV and BESS can cover part of the instantaneous load, while the generator restores energy over a longer period. The design must still pass sustained-duty, low-sun, SOC-recovery, transient and minimum-generator-load tests.
How large should the battery be?
Calculate usable kWh for the defined deficit/autonomy period and required kW for the largest source-load gap and transient. Then apply the quoted battery's SOC, temperature, ageing and warranty limits. There is no universal charger-to-battery ratio.
Can solar panels charge the EV directly?
Only through compatible power conversion, control, protection and EV-charging communication. Solar output also varies, so a commercial DC site usually needs storage, grid or generation support unless charging can follow PV availability.
What happens during several low-sun days?
The approved dispatch plan should start the generator or reduce non-critical charging before the BESS reaches its protected SOC floor. Model the worst design period, fuel availability and recovery time rather than promising a generic number of autonomy days.
Is OCPP the same as the microgrid EMS?
No. OCPP connects the charger to a charging-station management system. The EMS controls site energy sources and limits. They may exchange power limits or schedules, but the integration and fallback behavior must be specified and tested.
How can a buyer verify fuel savings?
Agree the diesel-only baseline, load/service level, metering boundaries, fuel measurement and reporting period before operation. Compare like-for-like delivered energy and reliability, then separate weather, traffic and load changes from system performance.
Request a configuration-bound hybrid charging study
Send HG Power the twelve RFQ inputs above, plus any existing single-line diagram and generator data. We can map the charging duty to a bounded architecture, identify missing project evidence and prepare a configuration request within the relevant 40–480 kW DC charging portfolio. Final equipment, connector, standards, protection, fuel, PV and battery scope remains order- and destination-specific.
Reviewed by Marvin
Primary references
- IEA PVPS, A user guide to simple monitoring and sustainable operation of PV-diesel hybrid systems: https://iea-pvps.org/wp-content/uploads/2020/01/Task_9___User_guide_monitoring_PV_diesel_hybrid_systems.pdf
- IEA PVPS, Optimal integration of Photovoltaic in Micro-grids that are dominated by diesel power-plants: https://iea-pvps.org/wp-content/uploads/2020/02/IEA-PVPS_T09-19-2019-REPORT_Integration_of_PV_in_Diesel_Micro-grids.pdf
- IEA PVPS, PV-Powered Charging Stations: Sizing, Optimization and Control: https://iea-pvps.org/key-topics/pv-charging-stations-2026/
- Sandia National Laboratories, Sizing behind-the-meter energy storage and solar for electric vehicle fast-charging stations: https://www.sandia.gov/research/publications/details/sizing-behind-the-meter-energy-storage-and-solar-for-electric-vehicle-fast-2020-09-01/
- U.S. Department of Energy, Solar Integration: Distributed Energy Resources and Microgrids Basics: https://www.energy.gov/cmei/systems/solar-integration-distributed-energy-resources-and-microgrids-basics
- U.S. DOE FEMP, Microgrid System Project Development Checklist: https://www.energy.gov/cmei/femp/articles/microgrid-system-project-development-checklist
- HG Power, 绿色能源升级解决方案—光柴储一体机产品发布, V2.0, 2025-10-25 (supplied company presentation).