
How Long Does It Take to Charge an Electric Car? 7 kW, 30 kW and 60 kW Explained
Estimate the energy window, find the lowest active power ceiling, use session-average accepted power, then add the operational clock.
Direct answer: Charging an electric car can take minutes or more than a day. For a defined 42 kWh battery-energy window, pure arithmetic is 6 hours at a sustained 7 kW average, 84 minutes at 30 kW and 42 minutes at 60 kW. Those are not universal session promises: the useful estimate first defines the energy the vehicle needs, then divides it by the average power the vehicle can actually accept across the selected state-of-charge window. Vehicle limits, charger limits, site allocation, temperature and charging taper all change the result.
This distinction matters to both drivers and commercial charging projects. A driver wants to know when the car can leave. A fleet manager needs every priority vehicle ready for dispatch. A site host needs to know whether bays will turn over, whether simultaneous sessions change the available power, and whether adding a higher-rated charger would solve the real constraint.
This guide gives one method for all three jobs. It does not promise a universal charging time, and none of the arithmetic examples represents a specific vehicle or product.
The core rule: estimate the energy window first; use session-average accepted power second; add operational time last.
The short answer: calculate an energy window, not a full battery
Most charging sessions do not run from a physically empty battery to 100%. A driver may arrive at 24% and need 70% for the next trip. A delivery vehicle may return with enough energy for another short route but still need a defined reserve before morning dispatch. A public fast-charging customer may stop when the next destination is safely reachable.
So the first question is not “How large is the battery?” It is:
How much usable energy must enter the battery between arrival and departure?
For a first-pass estimate:
Energy needed (kWh) = usable battery capacity (kWh) × (target SOC − arrival SOC)
An illustrative vehicle with 72 kWh of usable capacity moving from 20% to 80% would need:
72 kWh × (0.80 − 0.20) = 43.2 kWh
That is arithmetic, not a real-vehicle claim. Before using the formula in a project, confirm whether the published battery figure is usable or nominal, how the vehicle reports state of charge, and whether the operating requirement is better expressed as route energy, distance plus reserve, or departure SOC.
The US EPA's charging guidance distinguishes power in kilowatts from energy in kilowatt-hours and states the relationship kWh = kW × hours. That relationship is the foundation, but it only becomes a useful time estimate after the correct power boundary is chosen.
Do not hide the energy boundary
“Energy delivered” may refer to energy drawn at the grid meter, energy reported by the charging station, or energy added to the battery. Those values are not automatically identical. Conversion, battery conditioning, cabin loads and other auxiliaries can affect the boundary. A planning worksheet should name which measurement it uses instead of hiding all differences inside one universal loss percentage.
For a fleet, the strongest input is often measured energy from representative duty cycles, paired with arrival-SOC records. For a new vehicle, use current vehicle documentation and build a conservative scenario range until operating data exists.
Use average accepted power—not the charger's peak kW
Once the required energy is defined, the first-pass active charging time is:
Active energy-transfer time (h) = energy needed (kWh) ÷ session-average power measured at the same energy boundary (kW)
If the illustrative 43.2 kWh battery-energy window were delivered at a 90 kW battery-side average:
43.2 kWh ÷ 90 kW = 0.48 h = 28.8 min
The word average does most of the work. If a charger is labelled 150 kW, the vehicle may reach that power only briefly—or never. The vehicle may request less power at a high state of charge, when the battery is cold, or when its voltage/current limits become active. A shared site may temporarily allocate less power to that port. Equipment may also reduce output under a defined thermal or fault condition.
The result is a curve, not a flat line.
Peak Is Not Average
Delivered power follows the lowest active ceiling
This is a conceptual schematic, not a vehicle charging curve. The session average comes from the delivered-power trace across the chosen SOC window.
Imagine a graph with state of charge on the horizontal axis and power on the vertical axis:
- the charger ceiling is the most the configured port could offer;
- the vehicle request changes as the battery-management system controls the session;
- the site-allocation ceiling may move when other vehicles or building loads are active;
- the delivered-power curve stays under the lowest active ceiling;
- the area under that delivered-power curve represents energy transferred over time.
This is why dividing battery capacity by peak kW often produces an optimistic answer. A vehicle that briefly reaches 180 kW but averages 112 kW across the chosen SOC window should be estimated with the evidence-backed average for that window—not 180 kW.
The EPA notes that every vehicle has a maximum charging rate and that a vehicle limited to 50 kW does not charge faster merely because it is connected to a 150 or 350 kW charger. For DC fast charging, EPA also explains that power is generally higher when the battery is nearer empty and slows as it approaches full.
Active charging time is not total stop time
The 28.8-minute example above includes only energy transfer under its stated average. A driver's total session may also include:
- entering and positioning in the bay;
- connecting the cable;
- authentication or payment;
- vehicle–charger negotiation;
- a delayed start, pause or retry;
- taper beyond the planned SOC window;
- session stop and receipt processing;
- disconnecting and leaving the bay.
A commercial site should measure these separately. Hardware energy-transfer capability cannot by itself prove the customer or fleet turnaround time.
The Five-Limit Session Model
One estimate, five connected boundaries
→
→
→
→
The usable estimate is controlled by the lowest active boundary—not the largest number on the cabinet.
A defensible charging-time estimate needs five connected inputs. Missing any one can make a precise-looking result unreliable.
Limit 1 — Energy window
Define the required battery-energy increase or duty-cycle deficit. Record usable capacity, normal arrival SOC, target departure SOC and reserve logic. Use a distribution, not only one average, when arrival conditions vary.
What fails without it: the team calculates a full charge that operations never need, or undersizes the session for a high-energy day.
Limit 2 — Vehicle ceiling
For AC charging, the vehicle's onboard charger converts AC to DC and limits the accepted AC power. For DC charging, obtain the vehicle's compatible connector/inlet, voltage range, current/power acceptance and charging curve for the relevant battery and software version.
What fails without it: a higher-rated station is purchased even though the vehicle cannot use the additional power.
Limit 3 — Charger and port ceiling
Check the exact configured port—not only the cabinet family. Required fields can include DC voltage range, maximum current, maximum power, connector/cable configuration, cable thermal limit, power-module arrangement and the rule that applies when more than one output is active.
What fails without it: the bid says “240 kW dual connector,” but no one knows whether one vehicle, two vehicles or the cabinet as a whole owns that number.
Limit 4 — Site-allocation ceiling
At a multi-port or building-connected site, the power available to one session can depend on service capacity, transformer/switchgear limits, other building loads, load management, cabinet sharing and the priority assigned to simultaneous vehicles.
The US Department of Energy's managed-charging guidance for fleets describes control strategies that enforce power ceilings across multiple EVSE and respond to operating schedules and facility loads. That federal guidance is not a universal design rule, but it makes one planning point clear: a port's available power can be a controlled allocation rather than a permanent nameplate value.
What fails without it: a single-vehicle demonstration passes, while the real morning or evening arrival wave misses departure targets.
Limit 5 — Curve and conditions
Account for the selected SOC window, battery temperature, vehicle preconditioning, ambient conditions, battery protective controls, equipment derating, auxiliaries and recoverable interruptions. Use vehicle- and system-specific evidence wherever possible.
The US Department of Energy notes in its cold-weather guidance that preconditioning is available on many vehicles and that many batteries reduce fast-charging power in the 80–100% range. Do not turn that into a fixed cold penalty or one universal taper threshold: vehicle behavior varies.
What fails without it: the design is based on a warm, low-SOC demonstration and then judged against a cold, high-SOC operating day.
Evidence table: what to collect before quoting a time
| Missing input | False assumption it creates | Evidence to request |
|---|---|---|
| Usable capacity and SOC window | Every session is 0–100% | Current vehicle data plus operating SOC records |
| AC onboard-charger limit | EVSE rating equals AC battery power | Vehicle AC charging specification |
| DC voltage/current and curve | Peak DC kW is constant | Manufacturer curve or controlled session log for the relevant version |
| Port/cabinet allocation logic | Each connector receives full nameplate power | Model-specific allocation table and simultaneous-session test |
| Site available capacity | Charger always receives unrestricted input | Electrical load study, service data and control objective |
| Temperature/preconditioning state | One test applies year-round | Vehicle guidance and representative-condition logs |
| Session overhead and failure recovery | Energy-transfer time equals bay time | CSMS/charger session events and site observations |
AC and DC charging follow different power paths
The search phrase “how long does it take to charge an electric car?” often mixes two fundamentally different paths.
With AC charging, the station supplies controlled AC power and the vehicle's onboard charger converts it to DC for the battery. The accepted power therefore stops at the lowest of the EVSE setting, the vehicle's onboard limit and the site's current allocation. A 22 kW AC station cannot deliver 22 kW to a vehicle whose onboard charger accepts 11 kW.
With DC charging, the conversion occurs in the charging equipment and DC is supplied toward the traction battery under vehicle–charger control. The vehicle's BMS still determines what it will request and accept within the compatible voltage/current envelope. “DC” removes the onboard AC charger from the path; it does not remove the vehicle as a limit.
For a deeper AC sizing method, use the commercial Level 2 EV charger guide. For connector, voltage and current compatibility, use the CCS charger buyer's guide. For input capacity, commissioning and acceptance, use the DC fast charger station design guide.
Route the use case before selecting power
| Operating situation | First route to test | Why | When to test another route |
|---|---|---|---|
| Vehicles remain parked for many hours | AC or managed AC | Dwell can substitute for higher instantaneous power. | Energy deficit still exceeds what the vehicle's AC limit can receive before departure. |
| Short, scheduled turnaround | DC | A larger energy window must fit a shorter clock. | The vehicle lacks compatible DC charging or site input cannot support the required average. |
| Mixed fleet and mixed dwell | Mixed AC/DC | Different vehicle groups can use different service levels. | The operating team cannot control bay access or prioritisation. |
| Public destination with unpredictable stays | Service-design analysis first | Bay turnover, access and customer journey may dominate. | Demand and dwell data support a specific AC/DC mix. |
| Site power constrained but dwell is flexible | Managed charging | Allocation can shift among vehicles and time windows. | Even the full dwell window cannot meet priority departures. |
7 kW, 30 kW and 60 kW charging time: use one defined energy window
The real-GSC terms 7kw charging time, 30kw charging time and 60kw charging time cannot be answered safely with one vehicle-independent number. The table instead holds the battery-energy window constant at 42 kWh and changes only the session-average battery-side power. It is arithmetic, not a promise for any EV, charger or HG Power product.
| Illustrative average power | 42 kWh ÷ average power | First-pass active energy-transfer time |
|---|---|---|
| 7 kW | 42 ÷ 7 | 6 h |
| 30 kW | 42 ÷ 30 | about 84 min |
| 60 kW | 42 ÷ 60 | about 42 min |
| 120 kW | 42 ÷ 120 | about 21 min |
| 240 kW | 42 ÷ 240 | about 10 min 30 sec |
| 480 kW | 42 ÷ 480 | about 5 min 15 sec |
Do not read the table as “a 60 kW charger charges this car in 42 minutes,” or as evidence that a 480 kW cabinet can deliver a 5-minute public session. Either conclusion is valid only if the vehicle, port and site can sustain that stated average across the defined window and if the energy boundary is truly 42 kWh at the battery. The table also excludes queueing, authentication, negotiation, taper outside the window and disconnect time.
What a 7 kW question usually needs
A 7 kW enquiry is usually an AC dwell question, not an instruction to buy a 7 kW charger. Confirm the vehicle's onboard AC-charger limit, the circuit and EVSE setting, the arrival/target SOC, and the available parking time. A vehicle accepting less than 7 kW will take longer; an energy requirement smaller than 42 kWh will take less active time. For AC selection, use the commercial Level 2 EV charger guide after calculating the energy needed before departure.
What a 30 kW or 60 kW question usually needs
A 30 kW or 60 kW enquiry is normally a DC vehicle-fit and short-dwell question. Verify DC inlet compatibility, the vehicle's voltage/current acceptance over the intended SOC window, port or cabinet allocation when another vehicle connects, and site input capacity. A 60 kW label is a charger-side ceiling; it cannot force a vehicle to accept 60 kW, and it does not prove 60 kW will be sustained to a high target SOC.
Why 120–480 kW belongs in the same calculation, but not in the same promise
Higher DC ratings can reduce the energy-transfer clock only when a compatible vehicle, port and site can use the extra average power. The 120 kW, 240 kW and 480 kW guides therefore own exact configuration and RFQ decisions. This page owns the preceding calculation: define the energy window and prove the lowest active ceiling before treating a higher kW class as a time-saving decision.
Why a higher-rated charger may not reduce the session
When a session is slower than expected, replacing the charger with a larger nameplate is only one possible response. Diagnose the active constraint first.
The vehicle may already be the lowest ceiling
An EV's advertised DC peak is not the same as its average across every SOC window. Two vehicles connected to the same port can request very different power. One may be limited by its maximum current; another by its voltage architecture, thermal state or charging curve. A plug-in hybrid may not support DC fast charging at all.
For AC, the onboard charger can be the lowest ceiling. If the vehicle accepts 7 kW AC, changing a configured 11 kW EVSE to 22 kW will not shorten the same session.
Equal kW labels can hide different voltage/current fit
For DC, instantaneous electrical power follows power (kW) = voltage (V) × current (A) ÷ 1,000. A charger and vehicle must overlap across both voltage and current, not only share an attractive maximum-power number. Cable/current limits and the battery voltage at a particular SOC can prevent the session from reaching the theoretical kW.
This is why a commercial RFQ should request the output envelope and intended vehicle set, then verify actual sessions. Connector geometry alone does not prove that the intended power can be negotiated and sustained.
High SOC can extend the final part of the session
DC fast charging generally tapers as the battery approaches full, but the point and shape vary by vehicle, battery condition and software. If the mission only needs enough energy to reach the next stop, waiting for a high target SOC may use the bay for much longer than the same energy added earlier in the curve.
The decision is operational, not a universal battery recommendation. Set the target SOC from the required route, reserve policy and current vehicle-maker guidance.
Battery temperature and preconditioning can change acceptance
The charging station cannot force the battery to accept power that its management system is limiting. Cold or hot conditions, pack protection and whether the vehicle was preconditioned can change the request. Record battery or vehicle-reported conditions when investigating a slow session rather than blaming the charger from one kW screenshot.
Other vehicles and building loads may change allocation
At a managed or shared-power site, the active ceiling can change during the session. A vehicle may receive more power after another vehicle disconnects or a building load falls. Conversely, a late-arriving priority vehicle may receive a larger allocation under the site's control objective.
For fleets, DOE's smart-charge-management implementation guidance recommends collecting vehicle schedules, dwell, battery information, charging-station data and building loads. The lesson is portable even though the program context is US federal fleets: time and power must be evaluated as a system.
Diagnose the symptom before changing hardware
| Symptom | Possible active constraint | Verification | Decision or mitigation |
|---|---|---|---|
| Power never rises near the expected range | Vehicle limit, SOC, temperature, voltage/current mismatch or configured port limit | Vehicle request/charger log, SOC, battery condition, current and voltage | Compare with vehicle evidence; correct configuration or revise the expected time. |
| Power falls when a second vehicle starts | Cabinet or site allocation rule | Simultaneous-session log and model allocation table | Confirm whether behavior is intended; adjust priority, cabinet/port design or site capacity. |
| Warm low-SOC tests pass but winter sessions miss target | Vehicle thermal limit or equipment/site derating | Representative-condition tests and event logs | Use preconditioning where supported; revise reserve and seasonal scenario. |
| Energy-transfer time looks correct but queues remain | Bay, authentication, payment, parking or post-charge dwell | Time-stamped customer journey and bay observation | Improve access, process, signage, enforcement or port count—not only kW. |
| One vehicle charges as expected and another does not | Vehicle/interface/curve difference | Vehicle-by-vehicle test matrix | Segment the fleet and stop promising one universal time. |
| Sessions stop or restart | Communication, connector, protection, backend or operational issue | Error codes, CSMS/charger logs and repeatable test | Diagnose the fault path and recovery procedure before capacity expansion. |
The Three Clocks: driver time and operator time are not the same
Separate battery time from bay and business time
A charger specification can inform Clock 1. It cannot, by itself, prove Clock 2 or Clock 3.
“Charging time” can refer to three different clocks. A useful site plan names the one being measured.
Clock 1 — Energy-transfer time
This is the interval in which energy is actively delivered under the defined measurement boundary. It is the clock estimated by energy ÷ average power.
Use it to compare vehicle/charger scenarios and to determine whether the energy window could fit inside the dwell window. Do not use it alone to promise a customer stop time or a fleet turnaround.
Clock 2 — Connected-session time
This begins when the vehicle is connected and includes authentication, negotiation, pauses, taper, session stop and disconnect. It is closer to what a driver experiences at the charger.
Use station and backend event timestamps to separate connection, authorisation, energy flow and stop events. A site that records only total kWh cannot explain why two equal-energy sessions occupied the connector for different durations.
Clock 3 — Operational-turnaround time
This includes arrival, queue, bay access, positioning, cable handling, the connected session, post-charge parking and vehicle movement. It is the clock a public-site operator or fleet dispatcher often needs.
A 25-minute energy-transfer time can still create a 45-minute turnaround if the customer waits, has difficulty starting the session, or remains parked after charging. Conversely, a workplace vehicle may stay connected for eight hours while energy flows for only three; that may be acceptable if bay access is not scarce and power is managed.
HG Power planning framework: Clock 1 proves energy capability. Clock 2 tests the charging session. Clock 3 tests the operation.
For fleets, ask “ready by when?”
A fleet should not start with one average charging time for all vehicles. Start with departure commitments.
For each vehicle group, define:
- route or shift energy and reserve;
- arrival-time and arrival-SOC distribution;
- next departure and dispatch priority;
- compatible AC/DC paths and vehicle acceptance;
- whether vehicles can be moved after charging;
- the number of simultaneous arrivals;
- the degraded plan if a port, cabinet or network function is unavailable.
Then evaluate at least four scenarios.
| Scenario | Input change | Question the design must answer |
|---|---|---|
| Normal operating day | Typical route energy and dwell | Are all scheduled vehicles ready without unnecessary peak allocation? |
| High-energy day | Longer route, lower arrival SOC or greater auxiliary load | Which vehicles or ports become constrained first? |
| Short-dwell day | Late arrival or earlier dispatch | Does priority control recover readiness, or is a faster path required? |
| Degraded operation | One port/cabinet/control path unavailable | Can critical departures still be met safely? |
Managed charging may reduce the instantaneous power sent to one vehicle while improving the fleet outcome. For example, a long-dwell vehicle can temporarily receive less power so a near-departure vehicle can finish first. The correct KPI is not “every port always runs at maximum.” It is “priority vehicles receive the required energy before departure within the agreed site limit.”
For a full system acceptance path—from electrical inputs through FAT, site readiness and SAT—use the DC fast charger station guide. For commercial-property parking and access boundaries, use the EV charging solutions for commercial properties guide.
When not to buy more charger kW
More available power is valuable when it addresses the lowest active constraint. It can be wasted when it does not.
Do not make a higher charger rating the first response when:
- The vehicle cannot accept more. Obtain the AC limit or DC curve before increasing the port ceiling.
- The existing dwell window already meets the energy requirement. A lower-power, higher-port-count design may serve more parked vehicles.
- The site cannot allocate more. Confirm service, transformer, switchgear and concurrent loads before assuming a larger cabinet will deliver a larger average.
- Bay access is the bottleneck. More kW on one blocked port does not create another usable charging position.
- Redundancy is more important than one peak. A fleet may prefer multiple independently serviceable paths over dependence on one high-power asset.
- The target SOC is beyond the mission need. The final high-SOC portion may occupy scarce time without changing departure readiness.
- Failures and retries dominate the clock. Fix interoperability, process and recovery before purchasing more nominal capacity.
The opposite is also true: do not choose lower power merely to avoid infrastructure work if the result cannot meet a defined departure or public-service requirement. The purpose of the model is not to minimise kW. It is to select enough usable, verifiable power in the right number of ports.
What HG Power's current evidence can—and cannot—show
HG Power's approved commercial DC charging portfolio spans 40–480 kW. That is a portfolio statement, not one universal configuration or charging-time range.
One reviewed HG Power CCS1 manual lists five named floor-mounted models within that portfolio: 120, 180, 240, 360 and 480 kW. For that manual-listed family, the technical pages state a 200–1000 V DC nominal output range and dual CCS1 connectors. The same table contains a maximum-current row of 250 A with 350 A shown as optional, but it does not make the per-port and total-cabinet allocation clear enough to support a charging-time claim. These fields illustrate an important time-planning rule: power, voltage, current, connector, allocation and vehicle acceptance must be matched together.
They do not establish:
- how long a specific vehicle will charge;
- that one vehicle receives the cabinet's full nominal power;
- how both connectors allocate power simultaneously;
- that the same fields apply to 40/60/80 kW, CCS2 or another product family;
- that a configuration is approved for every destination.
Before comparing HG Power options, review the current technical specifications and request the exact model's output envelope, port-allocation behavior and document set. A 40–480 kW portfolio creates configuration choices; it does not replace the charging-time inputs.
Real installation context: what photographs prove

Real photographs help a buyer see that charging time sits inside a physical operation: vehicles must reach a bay, cables must reach inlets, multiple ports may serve one location, and the site needs safe circulation and electrical support.
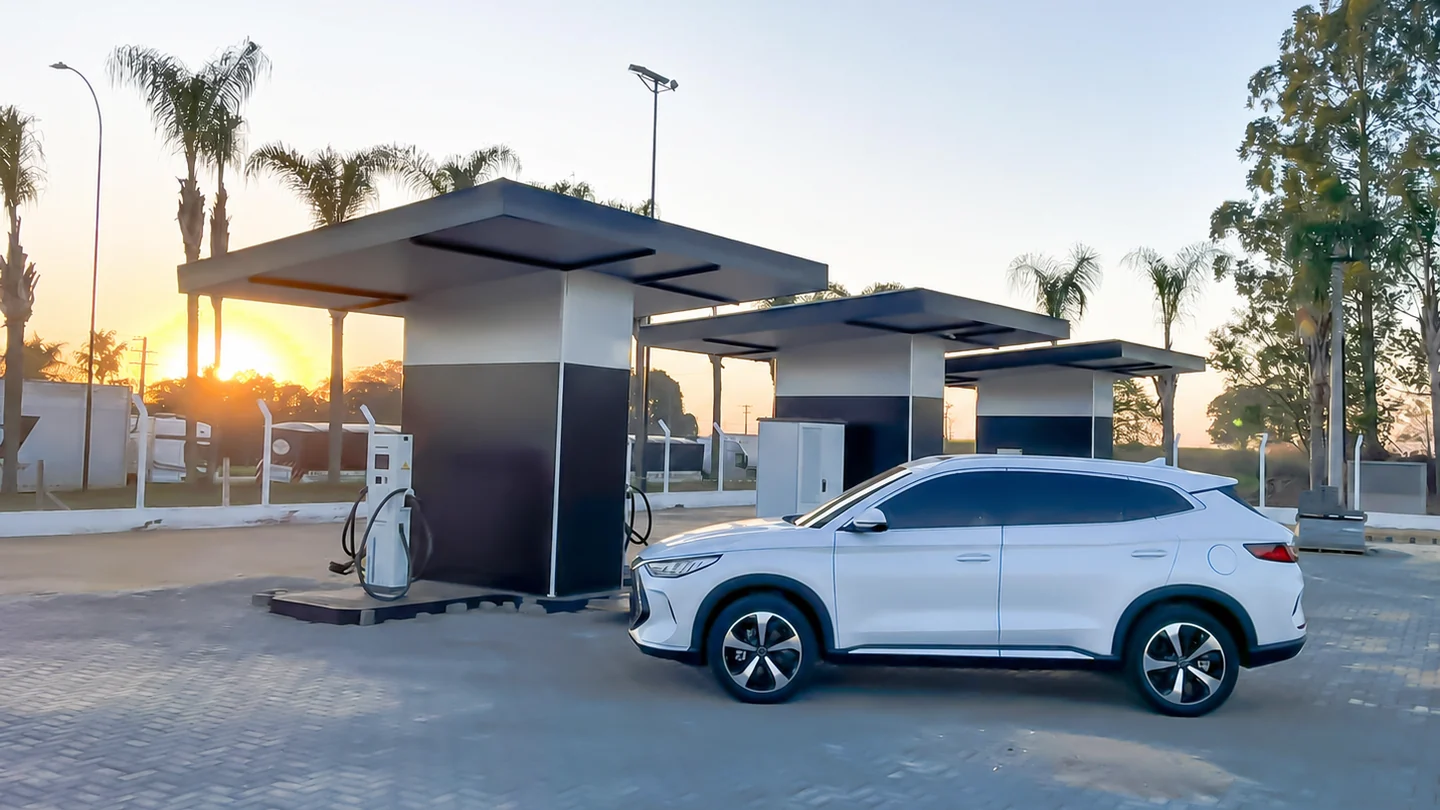
The first supplied overseas project image selected for this guide shows an outdoor charging area with multiple charging units and a vehicle. It can support a discussion of vehicle positioning and site context. It cannot prove the charger's rating, the vehicle's accepted power, session duration, throughput, uptime or customer result.
The second supplied image shows two installed charging units and marked bays. It can support a discussion of port count, simultaneous arrivals and physical access. It does not establish whether the units share power, which connectors they use, whether they are commissioned, or how fast any vehicle charged.
This evidence discipline matters. A photograph can show what exists in the frame; charging-time claims require time-stamped electrical and session data.
Copy this Charging-Time Input Sheet
Use the same input sheet for every vehicle group and every supplier scenario.
| Input | What to record | Why it changes time |
|---|---|---|
| Vehicle identity | Make, model, model year/version and representative quantity | Acceptance and curve can differ by vehicle/version. |
| Energy requirement | Usable capacity or measured duty-cycle kWh plus reserve | Defines the numerator. |
| SOC window | Arrival distribution and target departure SOC | Defines the energy window and curve region. |
| AC acceptance | Onboard-charger maximum and phase/market configuration | Caps AC charging power. |
| DC acceptance | Compatible inlet, voltage/current limits and curve evidence | Caps and shapes DC power. |
| Dwell/departure | Arrival window, connected time and hard dispatch deadline | Defines how much average power is required. |
| Concurrency | Vehicles arriving/charging together by time interval | Changes port demand and allocation. |
| Site electrical data | Supply, transformer/switchgear/service, spare capacity and other loads | Caps total available charging power. |
| Charger configuration | Exact model, port count, voltage/current envelope, cable and allocation rule | Defines what each active port can offer. |
| Conditions | Climate, parking environment, preconditioning and thermal assumptions | Can change vehicle or equipment behavior. |
| Operations | Authentication, payment, queuing, movement, fault response and support | Adds to connected and turnaround clocks. |
| Acceptance evidence | FAT/SAT cases, intended vehicles, SOC/condition matrix and log fields | Proves whether the planned result occurs. |
For hardware procurement fields beyond time, use the commercial EV charger buyer's guide. For a site-host operating model, use the public EV charging stations guide.
Frequently asked questions
How long does it take to charge an electric car at a public station?
It can take minutes or hours. Define the vehicle, arrival and target SOC, usable energy required, compatible charging path, session-average accepted power and any queue/session overhead. Public-station nameplate kW alone is not enough.
How long does 20% to 80% charging take?
First calculate 60% of the vehicle's usable battery capacity, then divide by evidence-backed average power for that vehicle across the 20–80% window. Add authentication, negotiation and other operational time separately. Do not substitute the vehicle's brief peak power for the window average.
Will a 350 kW charger always charge faster than a 150 kW charger?
No. It helps only when the vehicle can accept more than the lower charger's actual limit across enough of the selected SOC window, and when the port, cable and site can supply it. If the vehicle peaks below 150 kW or is limited by temperature, SOC, voltage/current or allocation, the difference may be small or zero.
Why does EV charging slow down near 80%?
Vehicle battery-management systems control charging power based on SOC, temperature and other protective limits. Many vehicles reduce DC power at higher SOC, but the threshold and curve are vehicle-specific. Use current automaker evidence; do not assume every EV follows the same 80% rule.
Does cold weather increase charging time?
It can. A cold battery may accept less power until conditions improve, and preconditioning behavior differs by vehicle. Equipment may also have its own environmental or derating limits. Use representative-condition tests and vehicle guidance instead of adding one fixed winter percentage.
Is charging time simply battery kWh divided by charger kW?
Only as a rough first step—and only if “charger kW” is replaced with the average power actually delivered at the chosen energy boundary across the selected SOC window. Add connected-session and operational-turnaround time separately.
How should a fleet estimate EV charging time?
Group vehicles by duty and charging capability. Model normal, high-energy, short-dwell and degraded scenarios. Use arrival/target SOC, route energy, departure priority, concurrency, site allocation and controlled-session evidence. Judge success by departure readiness, not whether every port reaches nameplate power.
Does HG Power offer 40–480 kW DC chargers?
HG Power's approved commercial DC portfolio spans 40–480 kW. Exact ratings, connector arrangements, voltage/current envelopes, port-allocation logic, communication options and compliance evidence depend on the quoted model and destination. Send the vehicle and site inputs for a model-specific response.
Turn the question into a testable charging plan
So, how long does it take to charge an electric car? The honest answer is a calculation with a boundary:
- define the energy the vehicle actually needs;
- identify the lowest vehicle, charger/port and site-allocation ceiling;
- use average accepted power across the required SOC window;
- test temperature, concurrency and degraded scenarios;
- add connected-session and operational-turnaround time.
If you are planning a commercial, public or fleet charging project, send HG Power the destination, vehicle list, battery/energy requirement, arrival and target SOC, dwell/dispatch window, simultaneous vehicle count, site electrical data, connector/backend requirements and acceptance cases through the contact page. We can use those inputs to discuss a model-specific configuration within the 40–480 kW DC portfolio—without turning a nameplate into an unsupported charging-time promise.
Send the vehicle, energy window, dwell or dispatch target, simultaneous vehicle count and site constraints.
About the technical review
Technical review: Marvin. Product statements were checked against the current supplied project records and the named CCS1 manual family. No title, credential or years-of-experience claim is made.
Sources and scope notes
- US EPA — Plug-in Electric Vehicle Charging: The Basics
- US EPA — Plug-in Electric Vehicle Charging: The Details
- US DOE Alternative Fuels Data Center — Electric Vehicle Charging Stations
- US DOE — Winterizing Your Electric Vehicle
- US DOE FEMP — Managed EV Charging for Federal Fleets
- US DOE FEMP — Smart Charge Management Implementation for Federal Fleets
- US DOE AFDC — EVI-X Toolbox
- HG Power, CCS1 120kW ~ 480kW DC Charger User Manual (Origin Gen 2), technical-data pages 101–103, reviewed 2026-09-02.
Government examples explain principles in their stated jurisdictions and program contexts; they are not universal installation or compliance rules. Product configuration, vehicle behavior, standards and destination requirements can change. Confirm current vehicle data, exact quoted model documents and local project requirements before purchase or installation.